Hello everyone,
We would appreciate a quick clarification regarding the reference aero data for cases D and E, both at Mach 0.40 and an altitude of 10,000 ft.
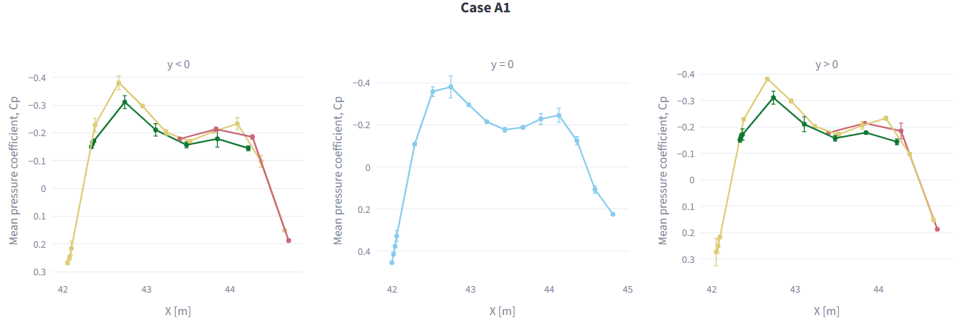
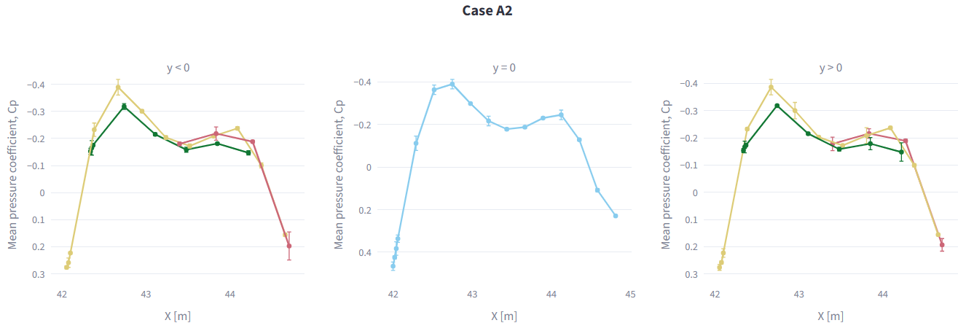
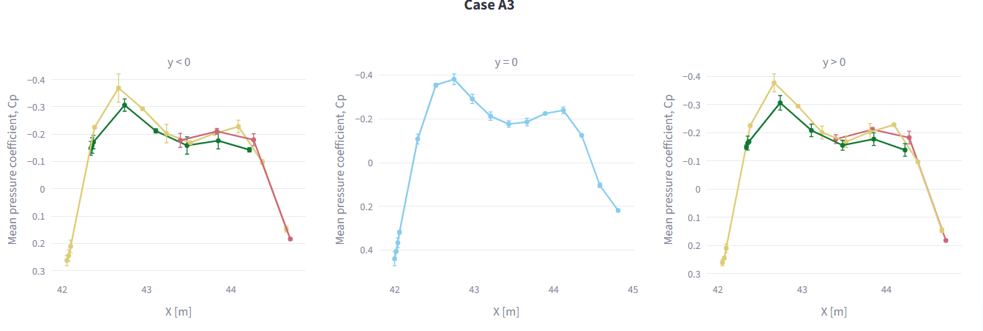
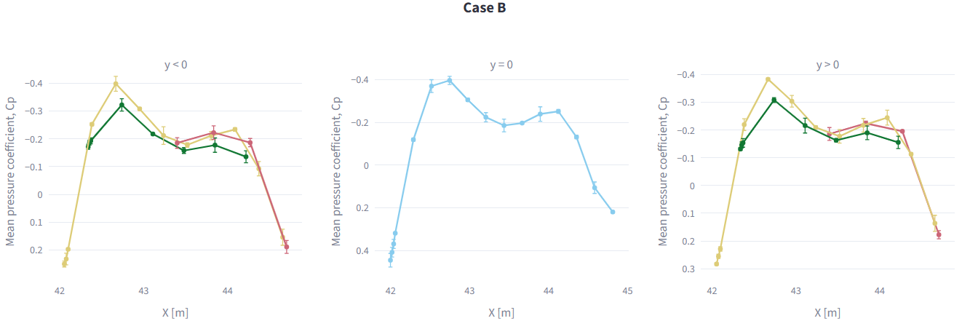
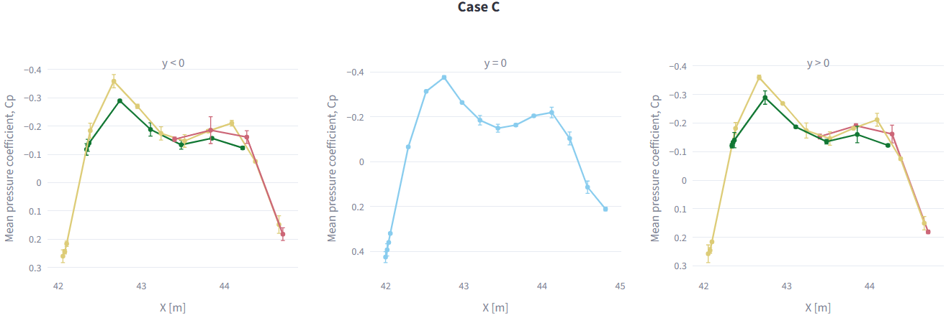
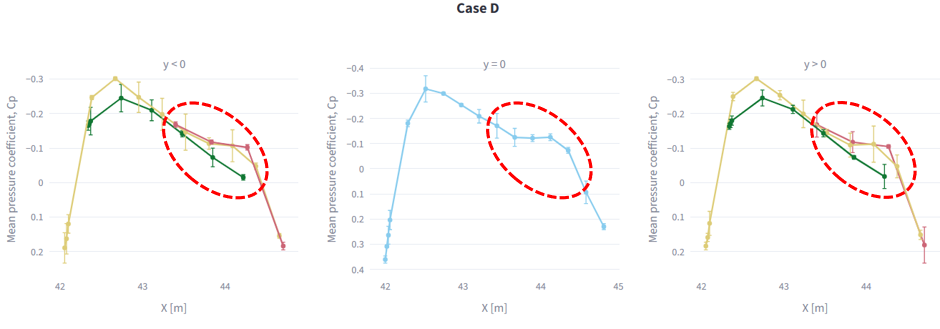
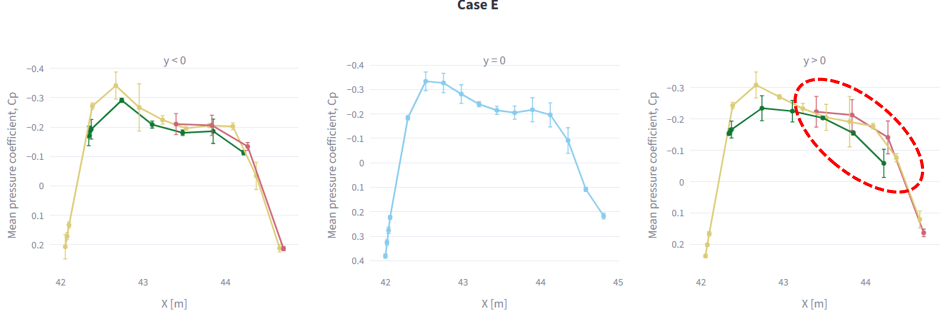
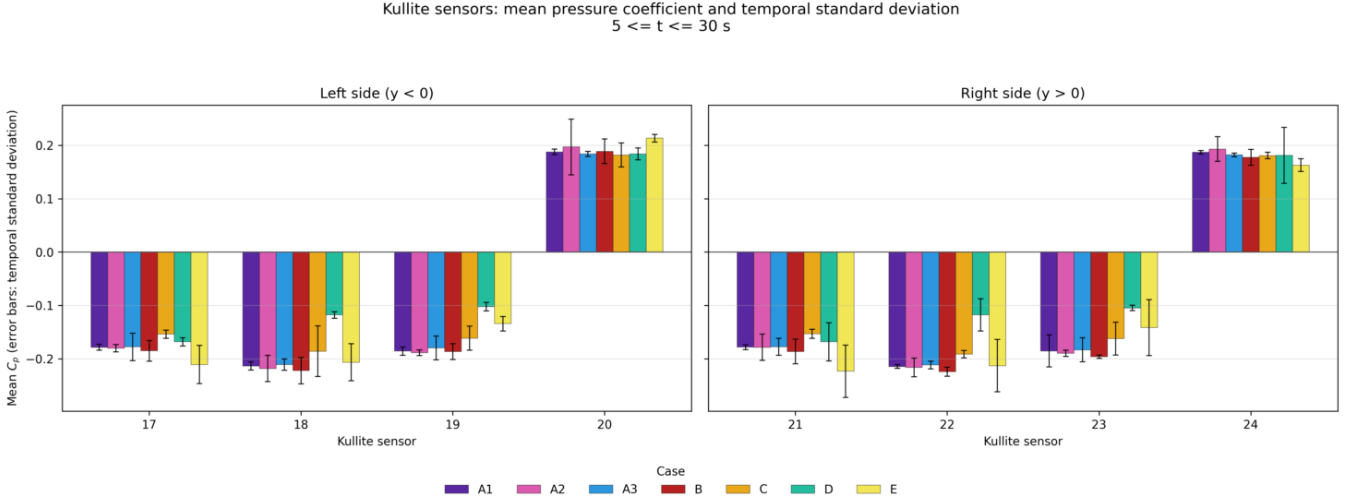
The mean pressure distribution shows a different trend near the trailing edge and in the outboard region compared with the other reference cases. In case D, the mean trend is visible on both sides, while the increased Kulite temporal variability is concentrated mainly on the positive-YYY side. In case E, both effects are more pronounced on the positive-YYY side.
The region where the mean pressure trend changes most clearly does not systematically coincide with the sensors showing the largest temporal standard deviations.
Could you please clarify:
- whether the mean pressure behavior is expected?
- whether it represents a different local flow behavior in cases D and E?
- whether the Kulite variability includes physical unsteadiness or should mainly be interpreted as synthetic noise?
Our current interpretation is that the temporal variability may be primarily associated with synthetic noise, but we would appreciate your confirmation before using this assumption in the model-form uncertainty assessment.
The attached figures illustrate the observations described above:

Thank you,
Débora Andrade
------------------------------
Debora Andrade
Embraer
Embraer S. A.
Sao Jose Dos Campos
------------------------------